IAAC’s Master in City & Technology (1 or 2-year program) is a unique program oriented towards redefining the analysis, planning, and design of twenty-first-century cities and beyond. The program offers expertise in the design of digitally enhanced, ecological and human-centered urban environments by intersecting the disciplines of urbanism and data science. Taking place in Barcelona, the capital of urbanism, the Master in City & Technology is training the professionals that city administrations, governments, industries, and communities need, to transform the urban environment in the era of big data.


Filters
Course

Annual and Cumulative Analysis of Pesticide Concentration in Multiple Locations: Understanding Trends and Patterns

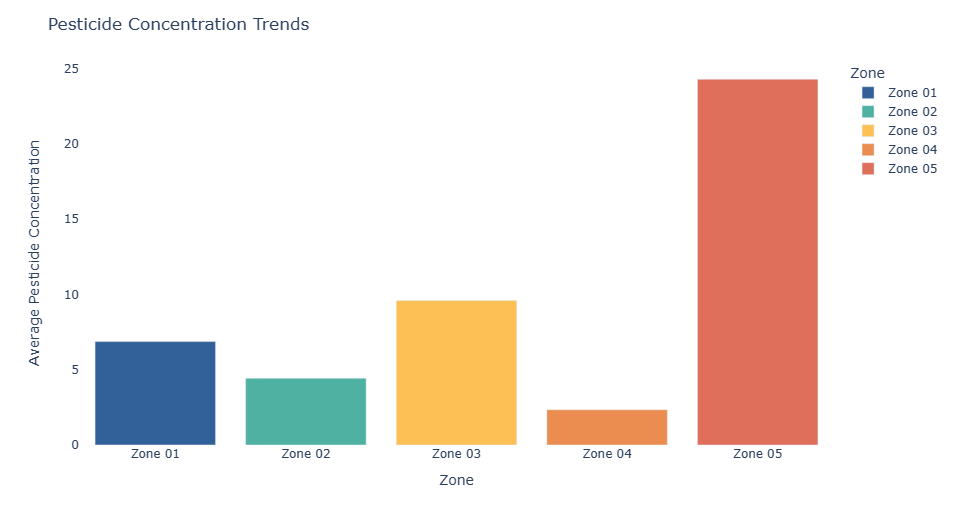
Introduction: Understanding the presence and distribution of pollutants like pesticides is crucial. In this blog post, I’ll delve into a Python-based analysis exploring pesticide concentration trends across diverse locations. I’ll use Python’s data analysis libraries to decipher annual trends and gain an overarching understanding of pesticide presence. Interpretation and Conclusion: My Python-based analysis shed light … Read more

Coding Nature

Investigating the Impact of Open Green Spaces on Airbnb Rates with Python 1. Introduction The industry of tourism in Barcelona has seen a major hike in the past couple years. Post-covid Barcelona has also become an educational hub for students from across the globe. The increase in Inflow of people has also made platform urbanism … Read more

The CourtForge

Enlarging the great… Emanuel Ginobili is one of the most -if not the most- accomplished Argentinian basketball players. During his 16 season basketball career in the NBA, that went on from 2002 to 2018, he won 4 championships as one of the San Antonio Spurs “Big Three”, was named an All-Star twice, was selected for … Read more

Python Serpentine : Unraveling Insights in Barcelona’s Airbnb Data

In this blog post, we will walk through a comprehensive data analysis exercise using two datasets related to Barcelona – Airbnb listings and real estate prices. This exercise shows how the data was cleaned, transformed, explored, and visualized using Python alongside popular data science libraries such as Pandas and Plotly. Step 1: Download and Load … Read more

Visualizing GeoSpatial Data in Python – Going from Csv to Graph

Visualizing dataframes using Geopandas and Plotly in Python introduction Python is a versatile and easy-to-learn programming language. GeoPandas extends the data manipulation capabilities of pandas to spatial data, providing a familiar and convenient environment for working with both tabular and geographical data. GeoPandas makes it easy to load, explore, and analyze geographical data. You can … Read more

Visualizing data using Python

Using python as a digital tool to visualize and arrange datasets; trying to view household costs by accumulating various costs per week. Using the dataset and visualizing the various indices and topics of concern and further pointing out the accumulated average cost of all expenses in a household. Further visualizing the desired data as plotting … Read more

Embarking on Data Analysis (Python)

Embarking on the Python journey, I began by grasping the fundamental programming logics. This provided the basis for understanding program structure and execution, akin to learning the grammar of the language. Variables were introduced as the basic units for storing and manipulating data, laying the groundwork for more complex coding tasks. The concept of variables … Read more

Data Visualisation using Python

Introduction In today’s data-driven world, the ability to visualize data effectively is a key skill. This blog post introduces the fundamentals of data visualization using Python, a powerhouse in the data science toolkit. We’ll explore essential libraries like GeoPandas, Plotly and Contextily, guiding you through the process of transforming raw data into insightful, visually appealing … Read more

Note Palette

Music is visualized everyday – but is there any accuracy to its representation? Can sound be accurately represented? If so, what does it look like? How is accuracy measured? While not fully satisfied with the answers found to these questions, Python’s mido package shed light on the how sound and color may be linked through … Read more

Data Visualization Using GeoPandas in Python

1.Geospatial Mapping using GeoPandas in Python In Python, GeoPandas plays a crucial role in facilitating geospatial analysis through its powerful functions. I will illustrate the concise process of leveraging GeoPandas to create maps of Barcelona. This involves a systematic application of GeoPandas’ functions for effective geospatial data synthesis and mapping. Step 1: Loading GeoDataFrame from … Read more

Visualization of Complex Innovation Data using Python

Innovation is a buzzword these days, and everyone seems to be talking about it. However, truly understanding it is a different ball game. Take the Global Innovation Index by the World Intellectual Property Organization (WIPO), for example. It’s a massive framework that pulls data from top-tier organizations worldwide, scoring countries on 100+ indicators. It’s a … Read more